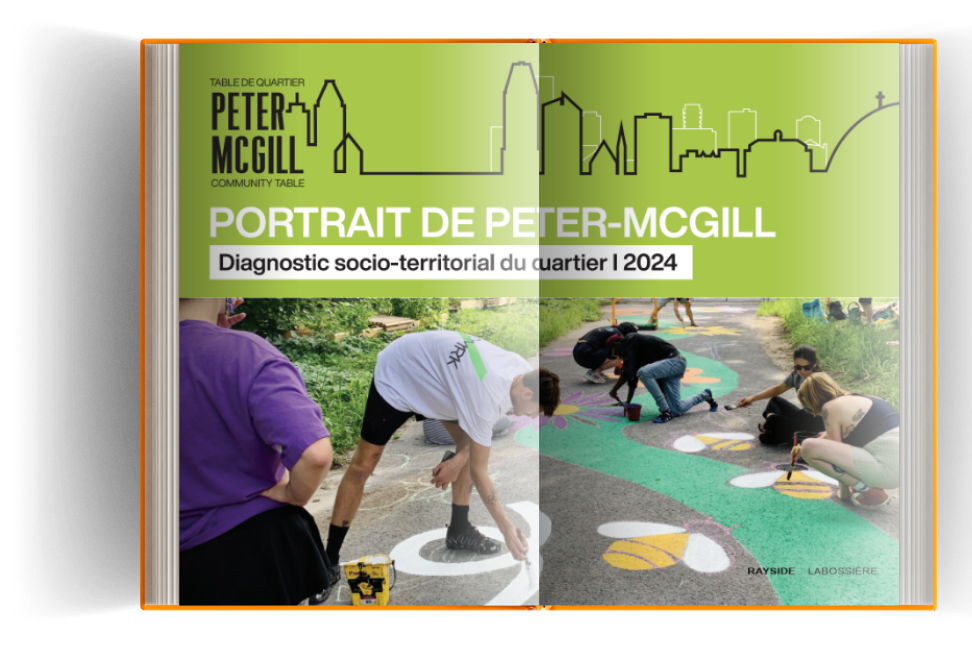
Neighborhood Profile 2024
This portrait was created at the initiative of the Peter-McGill Neighborhood Table with the aim of best illustrating all the characteristics of this area and clearly understanding the issues that persist, such as the lack of green and community spaces, as well as disparities in living conditions (housing value, income, unemployment…).
Despite the significant population growth since 2016 and the large proportion of people who spend more than 30% of their income on housing, the neighborhood has fewer nearby public services such as schools, daycare centers (CPE), sports and recreational facilities, green spaces, and social and affordable housing. In contrast, large-scale real estate projects are taking precedence.
DEMOGRAPHIC GROWTH
Peter-McGill’s population has been growing steadily since 1986.
Population growth was major between the years 2016 and 2021, with 9,448 new residents for this period. This represents major growth of 26.4%, compared to the 6.2% increase observed between 2011 and 2016.
We would like to thank the Rayside-Labossière team for their work in compiling and writing this new portrait, which reflects the dynamism and diversity of our neighborhood. We would also like to thank all the partners who contributed to the project by participating in the advisory committee or focus groups.

HOUSING
Peter-McGill had 34,547 housing units in 2021.
83.40% of these units are in buildings of more than 5 floors, compared to a proportion of 16% in Montreal.
HOUSEHOLDS
(32,0%)
OF HOUSEHOLDS IN
PETER-McGILL ARE FAMILIES.
(55,3%)
PEOPLE ARE LIVING ALONE IN
PETER- McGILL, WHICH IS THE MAJORITY OF HOMES.
REVENUS
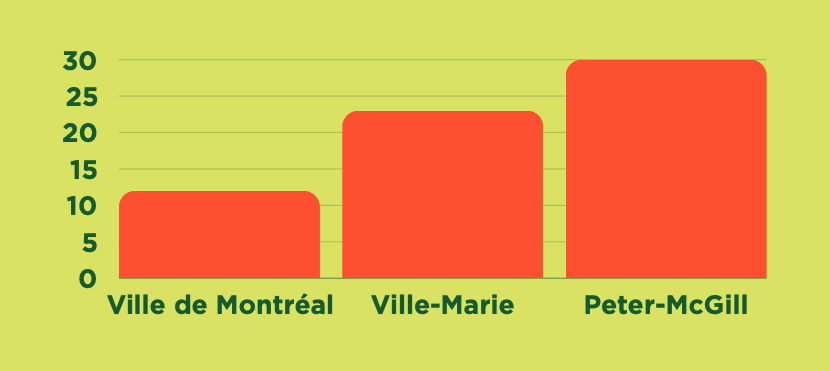
NEARLY ONE PERSON IN THREE LIVES BELOW THE LOW-INCOME RATE
While Ville-Marie is the Montreal district with the highest rate of low income, Peter-McGill has an even higher rate than the district itself. By comparison, 11.6% of the Montreal population is in the same situation.
This rate has dropped slightly since 2016, when it stood at 33.3% (Statistics Canada, 2016). The strong presence of students in the area could be part of the reason for this trend.
Concentration (%) of people below the low-income threshold.

LANGUAGES
16,410 Peter-McGill residents speak English only, or 36.3% of the population. This proportion is higher than in Montreal (27.2%) and Ville-Marie (13.7%), while it has increased since 2016 (33.6%) in Peter-McGill.
The majority (52.2%) of Peter-McGill residents have a non-official language as their mother tongue: 21,280 people.

IMMIGRATION
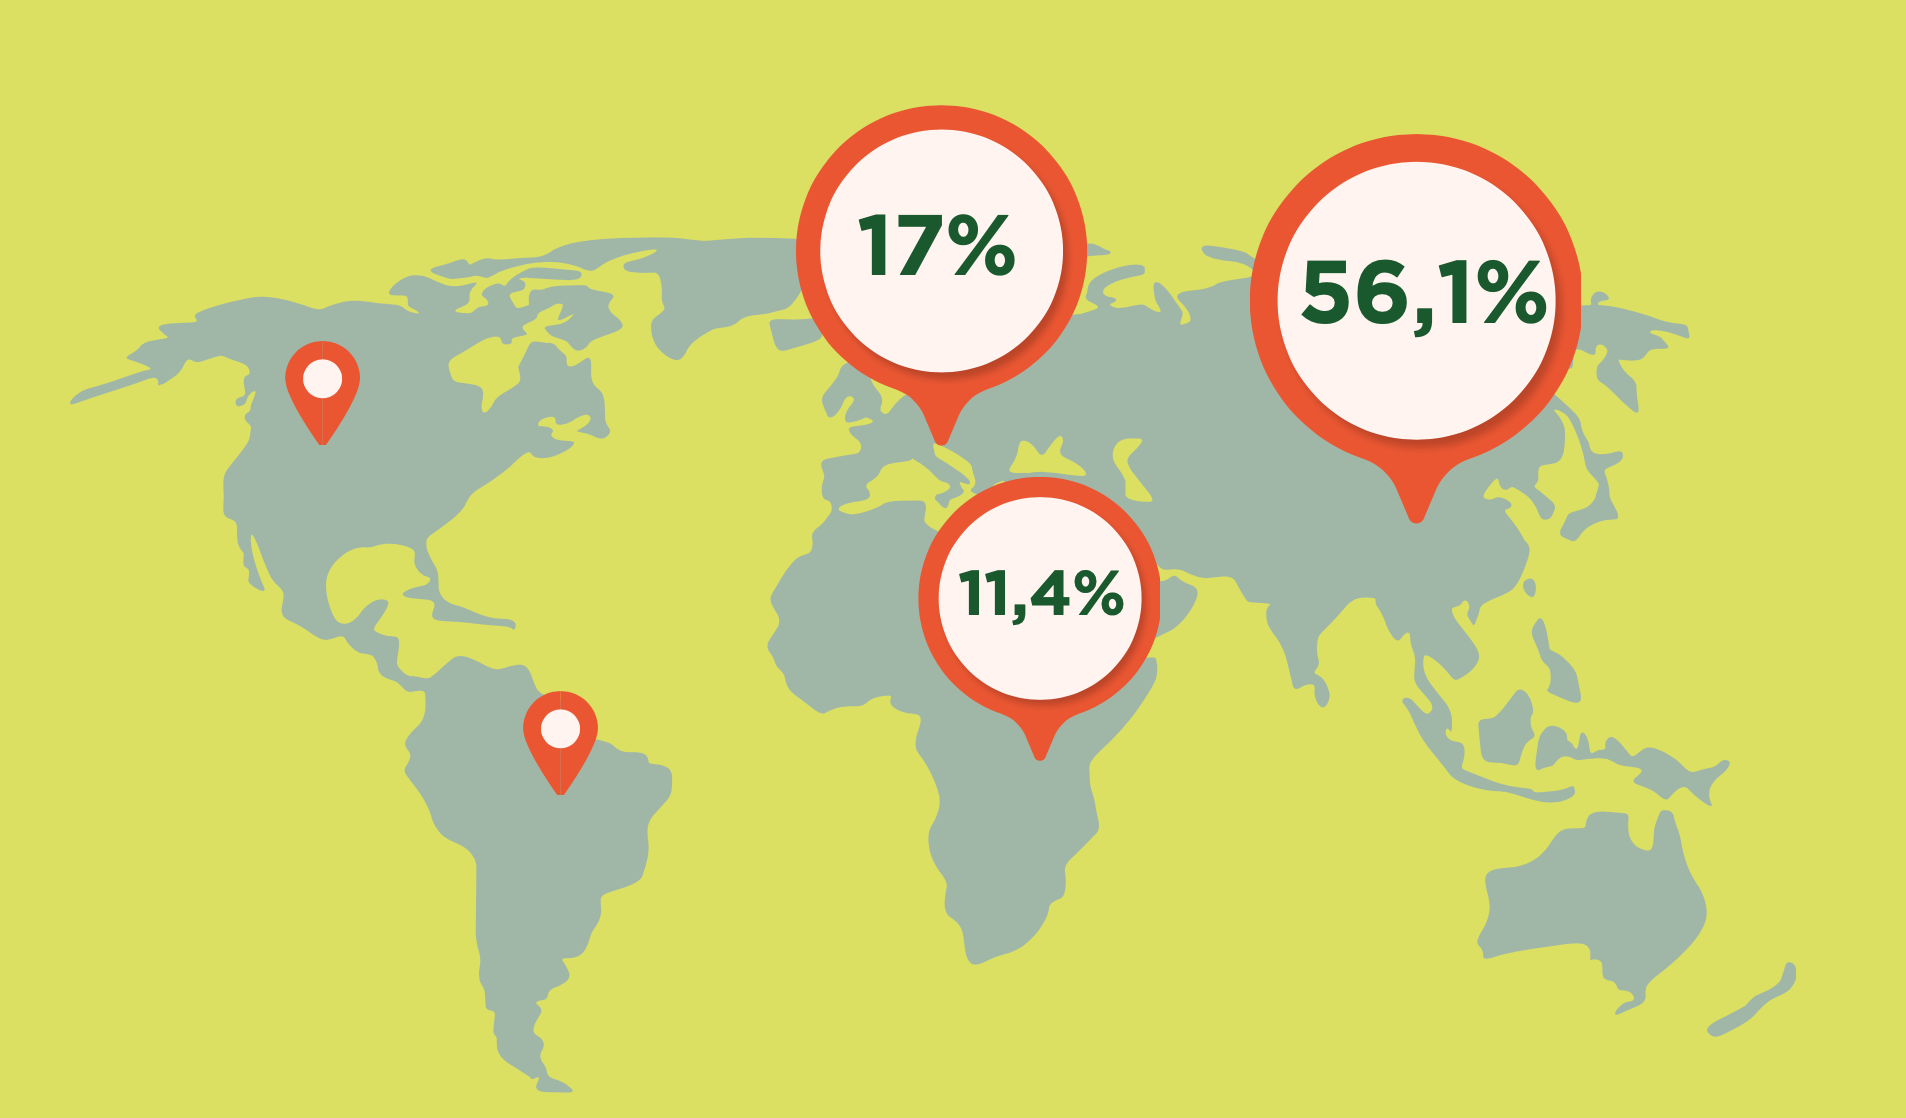
67,1 % of Peter-McGill residents, are from immigration.

Percentage of continents of origin of immigrants at Peter-McGill
POPULATION
(51,6%)
23,350 of people living in the neighborhood are
young adults aged 15 to 35.
This is much higher than in the city of Montreal, where young adults account for only 28.8% of the total population.
6,075 seniors aged 65 and over live in the neighborhood.
(51,6%)
